A New Graph Node Classification Benchmark: Learning Structure from Histology Cell Graphs
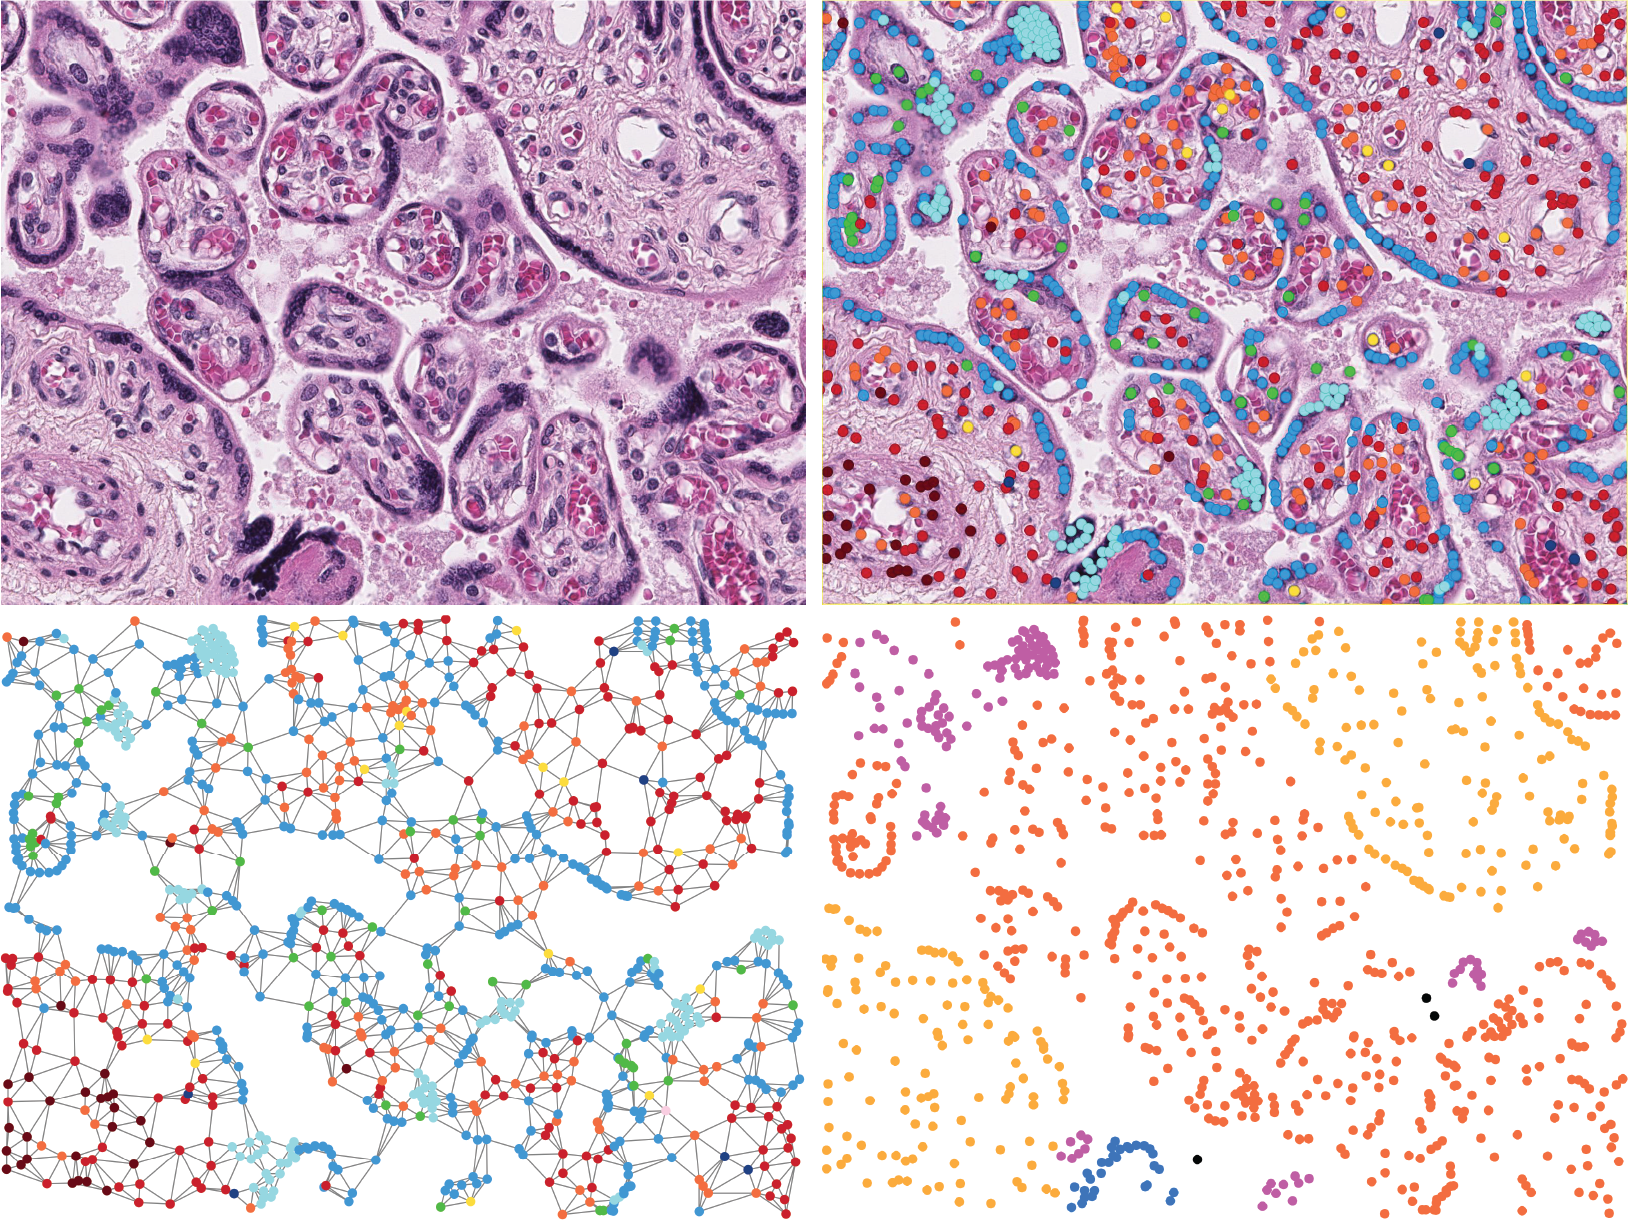
We introduce a new benchmark dataset, Placenta, for node classification in an underexplored domain: predicting microanatomical tissue structures from cell graphs in placenta histology whole slide images. This problem is uniquely challenging for graph learning for a few reasons. Cell graphs are large (>1 million nodes per image), node features are varied (64-dimensions of 11 types of cells), class labels are imbalanced (9 classes ranging from 0.21% of the data to 40.0%), and cellular communities cluster into heterogeneously distributed tissues of widely varying sizes (from 11 nodes to 44,671 nodes for a single structure). Here, we release a dataset consisting of two cell graphs from two placenta histology images totalling 2,395,747 nodes, 799,745 of which have ground truth labels. We present inductive benchmark results for 7 scalable models and show how the unique qualities of cell graphs can help drive the development of novel graph neural network architectures.
PDF AbstractCode


Datasets
Introduced in the Paper:
 Placenta

