Breaking the Limit of Graph Neural Networks by Improving the Assortativity of Graphs with Local Mixing Patterns
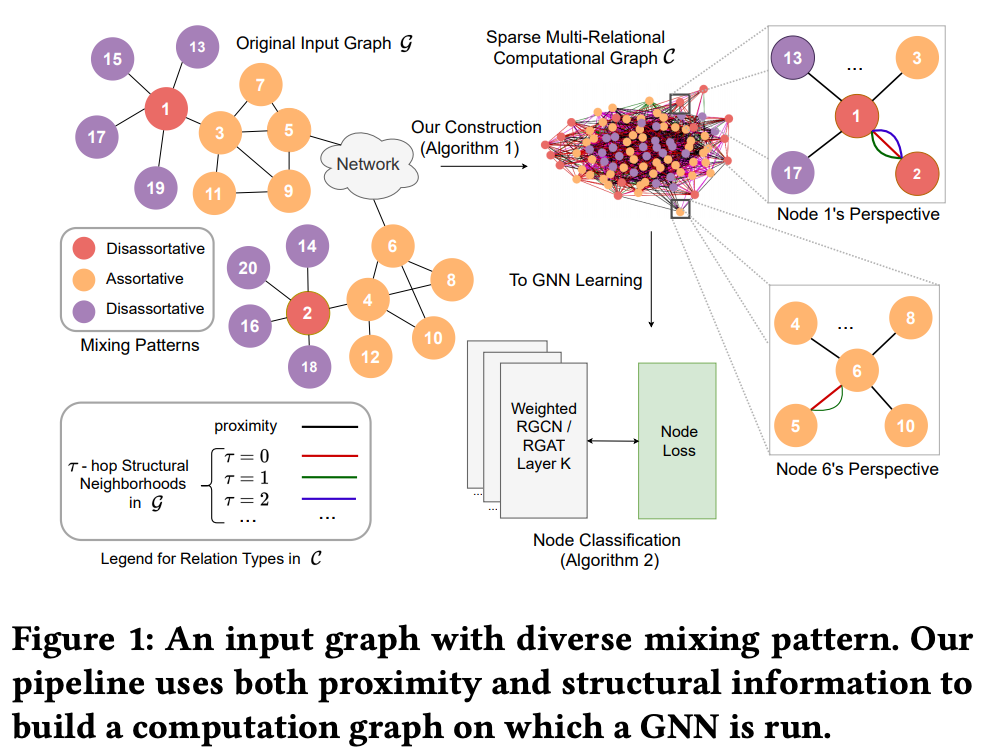
Graph neural networks (GNNs) have achieved tremendous success on multiple graph-based learning tasks by fusing network structure and node features. Modern GNN models are built upon iterative aggregation of neighbor's/proximity features by message passing. Its prediction performance has been shown to be strongly bounded by assortative mixing in the graph, a key property wherein nodes with similar attributes mix/connect with each other. We observe that real world networks exhibit heterogeneous or diverse mixing patterns and the conventional global measurement of assortativity, such as global assortativity coefficient, may not be a representative statistic in quantifying this mixing. We adopt a generalized concept, node-level assortativity, one that is based at the node level to better represent the diverse patterns and accurately quantify the learnability of GNNs. We find that the prediction performance of a wide range of GNN models is highly correlated with the node level assortativity. To break this limit, in this work, we focus on transforming the input graph into a computation graph which contains both proximity and structural information as distinct type of edges. The resulted multi-relational graph has an enhanced level of assortativity and, more importantly, preserves rich information from the original graph. We then propose to run GNNs on this computation graph and show that adaptively choosing between structure and proximity leads to improved performance under diverse mixing. Empirically, we show the benefits of adopting our transformation framework for semi-supervised node classification task on a variety of real world graph learning benchmarks.
PDF Abstract


Datasets
 Wiki Squirrel
WebKB
Penn94
Cornell
Chameleon (48%/32%/20% fixed splits)
Squirrel (48%/32%/20% fixed splits)
Cornell (48%/32%/20% fixed splits)
Cora (48%/32%/20% fixed splits)
Citeseer (48%/32%/20% fixed splits)
Wisconsin (48%/32%/20% fixed splits)
PubMed (48%/32%/20% fixed splits)
Texas (48%/32%/20% fixed splits)
Film(48%/32%/20% fixed splits)
Wiki Squirrel
WebKB
Penn94
Cornell
Chameleon (48%/32%/20% fixed splits)
Squirrel (48%/32%/20% fixed splits)
Cornell (48%/32%/20% fixed splits)
Cora (48%/32%/20% fixed splits)
Citeseer (48%/32%/20% fixed splits)
Wisconsin (48%/32%/20% fixed splits)
PubMed (48%/32%/20% fixed splits)
Texas (48%/32%/20% fixed splits)
Film(48%/32%/20% fixed splits)

