Classification-Regression for Chart Comprehension
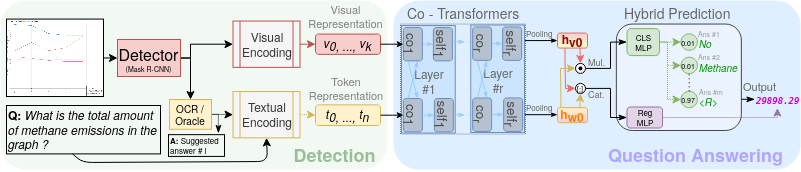
Chart question answering (CQA) is a task used for assessing chart comprehension, which is fundamentally different from understanding natural images. CQA requires analyzing the relationships between the textual and the visual components of a chart, in order to answer general questions or infer numerical values. Most existing CQA datasets and models are based on simplifying assumptions that often enable surpassing human performance. In this work, we address this outcome and propose a new model that jointly learns classification and regression. Our language-vision setup uses co-attention transformers to capture the complex real-world interactions between the question and the textual elements. We validate our design with extensive experiments on the realistic PlotQA dataset, outperforming previous approaches by a large margin, while showing competitive performance on FigureQA. Our model is particularly well suited for realistic questions with out-of-vocabulary answers that require regression.
PDF Abstract


 DVQA
DVQA
 PlotQA

