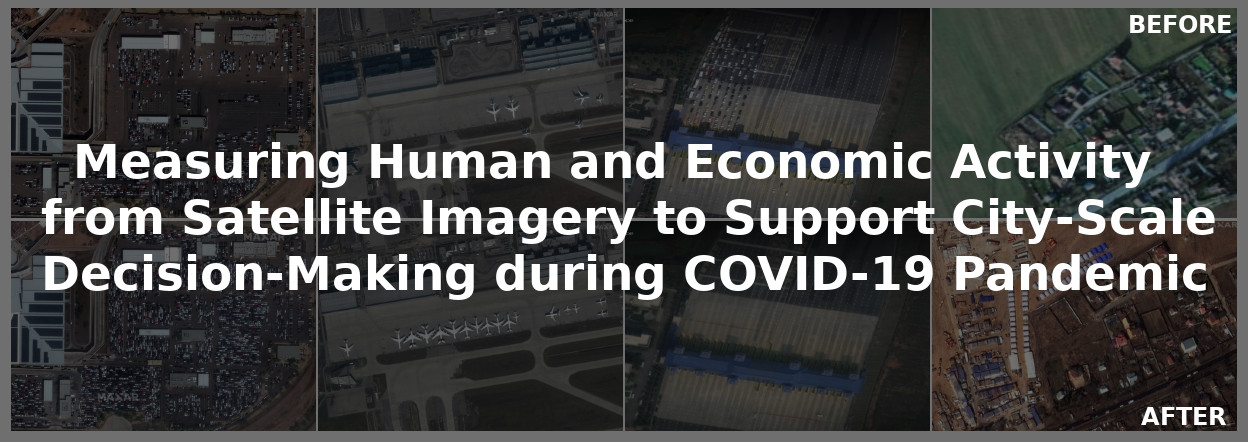
Measuring Human and Economic Activity from Satellite Imagery to Support City-Scale Decision-Making during COVID-19 Pandemic
The COVID-19 outbreak forced governments worldwide to impose lockdowns and quarantines to prevent virus transmission. As a consequence, there are disruptions in human and economic activities all over the globe. The recovery process is also expected to be rough. Economic activities impact social behaviors, which leave signatures in satellite images that can be automatically detected and classified. Satellite imagery can support the decision-making of analysts and policymakers by providing a different kind of visibility into the unfolding economic changes. In this work, we use a deep learning approach that combines strategic location sampling and an ensemble of lightweight convolutional neural networks (CNNs) to recognize specific elements in satellite images that could be used to compute economic indicators based on it, automatically. This CNN ensemble framework ranked third place in the US Department of Defense xView challenge, the most advanced benchmark for object detection in satellite images. We show the potential of our framework for temporal analysis using the US IARPA Function Map of the World (fMoW) dataset. We also show results on real examples of different sites before and after the COVID-19 outbreak to illustrate different measurable indicators. Our code and annotated high-resolution aerial scenes before and after the outbreak are available on GitHub (https://github.com/maups/covid19-satellite-analysis).
PDF Abstract

 fMoW
fMoW
 xView
xView
