Neural Sheaf Diffusion: A Topological Perspective on Heterophily and Oversmoothing in GNNs

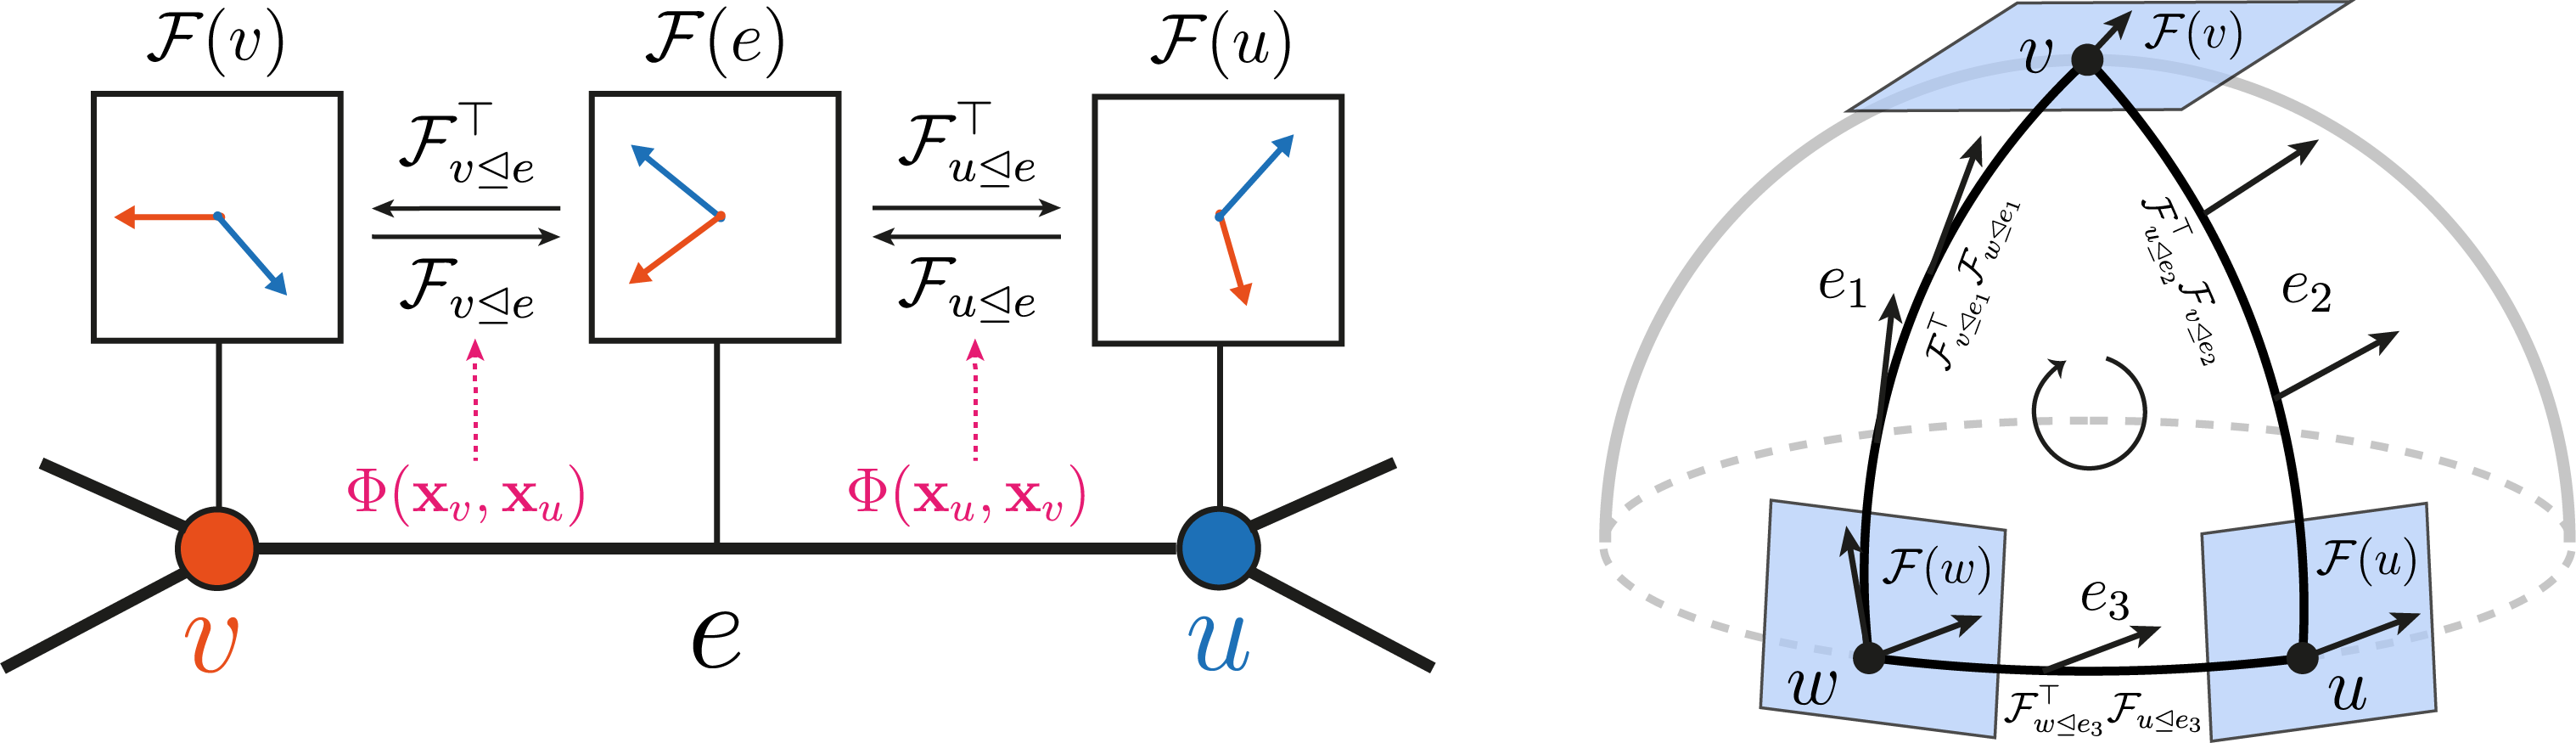
Cellular sheaves equip graphs with a "geometrical" structure by assigning vector spaces and linear maps to nodes and edges. Graph Neural Networks (GNNs) implicitly assume a graph with a trivial underlying sheaf. This choice is reflected in the structure of the graph Laplacian operator, the properties of the associated diffusion equation, and the characteristics of the convolutional models that discretise this equation. In this paper, we use cellular sheaf theory to show that the underlying geometry of the graph is deeply linked with the performance of GNNs in heterophilic settings and their oversmoothing behaviour. By considering a hierarchy of increasingly general sheaves, we study how the ability of the sheaf diffusion process to achieve linear separation of the classes in the infinite time limit expands. At the same time, we prove that when the sheaf is non-trivial, discretised parametric diffusion processes have greater control than GNNs over their asymptotic behaviour. On the practical side, we study how sheaves can be learned from data. The resulting sheaf diffusion models have many desirable properties that address the limitations of classical graph diffusion equations (and corresponding GNN models) and obtain competitive results in heterophilic settings. Overall, our work provides new connections between GNNs and algebraic topology and would be of interest to both fields.

PDF Abstract
Task Dataset Model Metric Name Metric Value Global Rank Result Benchmark
Node Classification Actor O(d)-NSD Accuracy 37.81 ± 1.15 # 9
Node Classification Actor Diag-NSD Accuracy 37.79 ± 1.01 # 11
Node Classification Actor Gen-NSD Accuracy 37.80 ± 1.22 # 10
Node Classification Chameleon O(d)-NSD Accuracy 68.04 ± 1.58 # 36
Node Classification Chameleon Diag-NSD Accuracy 68.68 ± 1.73 # 31
Node Classification Chameleon Gen-NSD Accuracy 67.93 ± 1.58 # 37
Node Classification on Non-Homophilic (Heterophilic) Graphs Chameleon (48%/32%/20% fixed splits) Gen-NSD 1:1 Accuracy 67.93 ± 1.58 # 17
Node Classification on Non-Homophilic (Heterophilic) Graphs Chameleon (48%/32%/20% fixed splits) Diag-NSD 1:1 Accuracy 68.68 ± 1.73 # 13
Node Classification on Non-Homophilic (Heterophilic) Graphs Chameleon (48%/32%/20% fixed splits) O(d)-NSD 1:1 Accuracy 68.04 ± 1.58 # 16
Node Classification Citeseer (48%/32%/20% fixed splits) O(d)-NSD 1:1 Accuracy 76.70 ± 1.57 # 17
Node Classification Citeseer (48%/32%/20% fixed splits) Gen-NSD 1:1 Accuracy 76.32 ± 1.65 # 19
Node Classification Citeseer (48%/32%/20% fixed splits) Diag-NSD 1:1 Accuracy 77.14 ± 1.85 # 9
Node Classification Cora (48%/32%/20% fixed splits) O(d)-NSD 1:1 Accuracy 86.90 ± 1.13 # 20
Node Classification Cora (48%/32%/20% fixed splits) Diag-NSD 1:1 Accuracy 87.14 ± 1.06 # 19
Node Classification Cora (48%/32%/20% fixed splits) Gen-NSD 1:1 Accuracy 87.30 ± 1.15 # 18
Node Classification Cornell Diag-NSD Accuracy 86.49 ± 7.35 # 7
Node Classification Cornell Gen-NSD Accuracy 85.68 ± 6.51 # 15
Node Classification Cornell O(d)-NSD Accuracy 84.86 ± 4.71 # 22
Node Classification on Non-Homophilic (Heterophilic) Graphs Cornell (48%/32%/20% fixed splits) Diag-NSD 1:1 Accuracy 86.49 ± 7.35 # 1
Node Classification on Non-Homophilic (Heterophilic) Graphs Cornell (48%/32%/20% fixed splits) Gen-NSD 1:1 Accuracy 85.68 ± 6.51 # 6
Node Classification on Non-Homophilic (Heterophilic) Graphs Cornell (48%/32%/20% fixed splits) O(d) - NSD 1:1 Accuracy 84.86 ± 4.71 # 13
Node Classification on Non-Homophilic (Heterophilic) Graphs Film(48%/32%/20% fixed splits) Gen-NSD 1:1 Accuracy 37.80 ± 1.22 # 3
Node Classification on Non-Homophilic (Heterophilic) Graphs Film(48%/32%/20% fixed splits) O(d)-NSD 1:1 Accuracy 37.81 ± 1.15 # 2
Node Classification on Non-Homophilic (Heterophilic) Graphs Film(48%/32%/20% fixed splits) Diag-NSD 1:1 Accuracy 37.79 ± 1.01 # 4
Node Classification PubMed (48%/32%/20% fixed splits) Gen-NSD 1:1 Accuracy 89.33 ± 0.35 # 12
Node Classification PubMed (48%/32%/20% fixed splits) O(d)-NSD 1:1 Accuracy 89.49 ± 0.40 # 9
Node Classification PubMed (48%/32%/20% fixed splits) Diag-NSD 1:1 Accuracy 89.42 ± 0.43 # 11
Node Classification Squirrel O(d)-NSD Accuracy 56.34 ± 1.32 # 28
Node Classification Squirrel Diag-NSD Accuracy 54.78 ± 1.81 # 33
Node Classification Squirrel Gen-NSD Accuracy 53.17 ± 1.31 # 35
Node Classification on Non-Homophilic (Heterophilic) Graphs Squirrel (48%/32%/20% fixed splits) O(d)-NSD 1:1 Accuracy 56.34 ± 1.32 # 13
Node Classification on Non-Homophilic (Heterophilic) Graphs Squirrel (48%/32%/20% fixed splits) Gen-NSD 1:1 Accuracy 53.17 ± 1.31 # 17
Node Classification on Non-Homophilic (Heterophilic) Graphs Squirrel (48%/32%/20% fixed splits) Diag-NSD 1:1 Accuracy 54.78 ± 1.81 # 16
Node Classification Texas Gen-NSD Accuracy 82.97 ± 5.13 # 38
Node Classification Texas Diag-NSD Accuracy 85.67 ± 6.95 # 23
Node Classification Texas O(d)-NSD Accuracy 85.95 ± 5.51 # 20
Node Classification on Non-Homophilic (Heterophilic) Graphs Texas (48%/32%/20% fixed splits) O(d)-NSD 1:1 Accuracy 85.95 ± 5.51 # 7
Node Classification on Non-Homophilic (Heterophilic) Graphs Texas (48%/32%/20% fixed splits) Gen-NSD 1:1 Accuracy 82.97 ± 5.13  # 16
Node Classification on Non-Homophilic (Heterophilic) Graphs Texas (48%/32%/20% fixed splits) Diag-NSD 1:1 Accuracy 85.67 ± 6.95 # 8
Node Classification Wisconsin Diag-NSD Accuracy 88.63 ± 2.75 # 7
Node Classification Wisconsin Gen-NSD Accuracy 89.21 ± 3.84 # 5
Node Classification Wisconsin O(d)-NSD Accuracy 89.41 ± 4.74 # 4
Node Classification on Non-Homophilic (Heterophilic) Graphs Wisconsin (48%/32%/20% fixed splits) Diag-NSD 1:1 Accuracy 88.63 ± 2.75 # 3
Node Classification on Non-Homophilic (Heterophilic) Graphs Wisconsin (48%/32%/20% fixed splits) O(d)-NSD 1:1 Accuracy 89.41 ± 4.74 # 1
Node Classification on Non-Homophilic (Heterophilic) Graphs Wisconsin (48%/32%/20% fixed splits) Gen-NSD 1:1 Accuracy 89.21 ± 3.84 # 2

Methods